Adjusted Survival Curves for Categorical Confounders using the Method by Cupples et al. (1995)
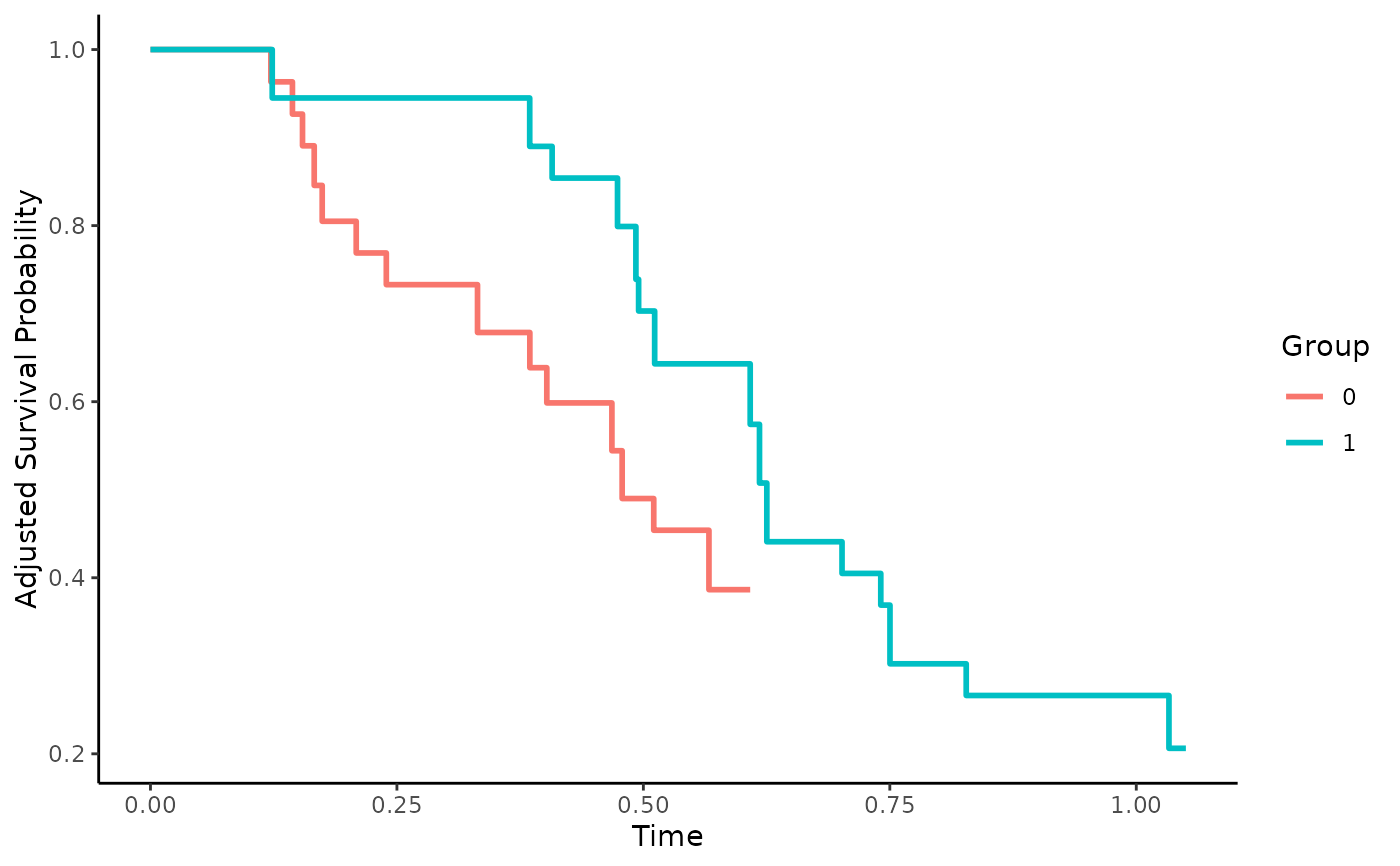
surv_strat_cupples.RdThis page explains the details of estimating confounder-adjusted survival curves using a weighted average of stratified Kaplan-Meier estimates using the method described in Cupples et al. (1995) (method="strat_cupples" in the adjustedsurv function). All regular arguments of the adjustedsurv function can be used. Additionally, the adjust_vars argument has to be specified in the adjustedsurv call. Further arguments specific to this method are listed below.
Arguments
- adjust_vars
[required] A single string or character vector specifying column names in data for which the survival curves should be adjusted for. The variables specified can be integers, factors or characters. Only categorical variables can be used with this method. See details.
- reference
A
data.frameto be used as a reference population when weighting the survival curves orNULL(default). IfNULLthe survival curves are weighted in reference to the full sample supplied usingdata, regardless of thevariablelevel. If adata.frameis supplied it needs to include all variables specified inadjust_vars.
Details
Type of Adjustment: The survival curves are adjusted by taking a weighted average of stratified Kaplan-Meier estimates. This only works for categorical confounders. See below for more information.
Doubly-Robust: Estimates are not Doubly-Robust.
Categorical groups: Any number of levels in
variableare allowed. Must be a factor variable.Approximate Variance: Calculations to approximate the variance and confidence intervals are not available. Bootstrap confidence intervals can however be calculated with all supported models. See
?adjustedsurvfor more information on bootstrapping.Allowed Time Values: Allows both continuous and integer time.
Bounded Estimates: Estimates are guaranteed to be bounded in the 0 to 1 probability range.
Monotone Function: Estimates are guaranteed to be monotone.
Dependencies: This method relies on the survival package.
This is one of the older adjustment methods described in the literature. It only works for categorical confounders. If adjustments for continuous confounders are desired, the user needs to explicitly categorize the continuous confounders. It is recommended to use one of the other methods implemented in this package in that case. The method works exactly as described in Cupples et al. (1995). First, stratified Kaplan-Meier estimates for each possible combination of all supplied variables (variable + adjust_vars) are calculated. If for example a dichotomous variable with the levels "Treatment" and "Control" is supplied in conjunction with a single dichotomous confounder "Sex" with the levels "male" and "female", this method would calculate four Kaplan-Meier curves (Treatment + male, Treatment + female, Control + male, Control + female). Next a simple weighted average of these survival curves is taken per level in variable, where the weights are the number of occurrences of each confounder level in the reference data. The reference data is the pooled sample by default, but external reference data can be used. A more detailed description can be found in the original article.
If a character vector is supplied in the adjust_vars argument, the Kaplan-Meier estimates are created for each combination of all supplied variables. If the sample size is small and/or there are many levels in these variables, the estimates can become unstable or undefined. Because it is a weighted average of Kaplan-Meier curves, estimates for this method are only defined for points in time with a valid Kaplan-Meier estimate in all strata. Continuing the example from above, if the Kaplan-Meier curve of the strata "Treatment + male" only extends to t = 100, it will be impossible to estimate the adjusted survival curve for t > 100 using this method.
References
A. Kramar and C. Com-Nougué (1990). "Estimation des courbes de survie ajustées". In: Revue d Épidémiologie et de Santé Publique 38.2, pp. 149-152
L. Adrienne Cupples, David R. Gragnon, Ratna Ramaswamy, and Ralph D’Agostino (1995). "Age-Adjusted Survival Curves with Application in the Framingham Study". In: Statistics in Medicine 14, pp. 1731-1744
Examples
library(adjustedCurves)
library(survival)

set.seed(42)

# simulate some data as example
sim_dat <- sim_confounded_surv(n=50, max_t=1.2)
sim_dat$group <- as.factor(sim_dat$group)

# adjust survival curves for some categorical confounders
adjsurv <- adjustedsurv(data=sim_dat,
                        variable="group",
                        ev_time="time",
                        event="event",
                        method="strat_cupples",
                        adjust_vars=c("x1", "x3"),
                        conf_int=FALSE)

# plot the curves
plot(adjsurv)
#> Warning: Removed 12 rows containing missing values or values outside the scale range
#> (`geom_step()`).
