Transform a DAG object into an igraph object
as.igraph.DAG.RdThis function extends the as.igraph function from the igraph package to allow the input of a DAG object. The result is an igraph object that includes only the structure of the DAG, without any specifications. May be useful for plotting purposes.
Usage
# S3 method for class 'DAG'
as.igraph(x, include_root_nodes=TRUE,
          include_td_nodes=TRUE, include_networks=FALSE, ...)
Arguments
- x
A
DAGobject created using theempty_dagfunction with nodes added to it using the+syntax. See?empty_dagor?nodefor more details. Supports DAGs with time-dependent nodes added using thenode_tdfunction. However, including such DAGs may result in cyclic causal structures, because time is not represented in the output matrix.- include_root_nodes
Whether to include root nodes in the output matrix. Should usually be kept at
TRUE(default).- include_td_nodes
Whether to include time-dependent nodes added to the
dagusing thenode_tdfunction or not. When including these types of nodes, it is possible for the adjacency matrix to contain cycles, e.g. that it is not a classic DAG anymore, due to the matrix not representing the passage of time.- include_networks
Whether to include time-fixed networks added to the
dagusing thenetworkfunction or not. Usually it does not make sense to include those, because they are not classical nodes.- ...
Currently not used.
Examples
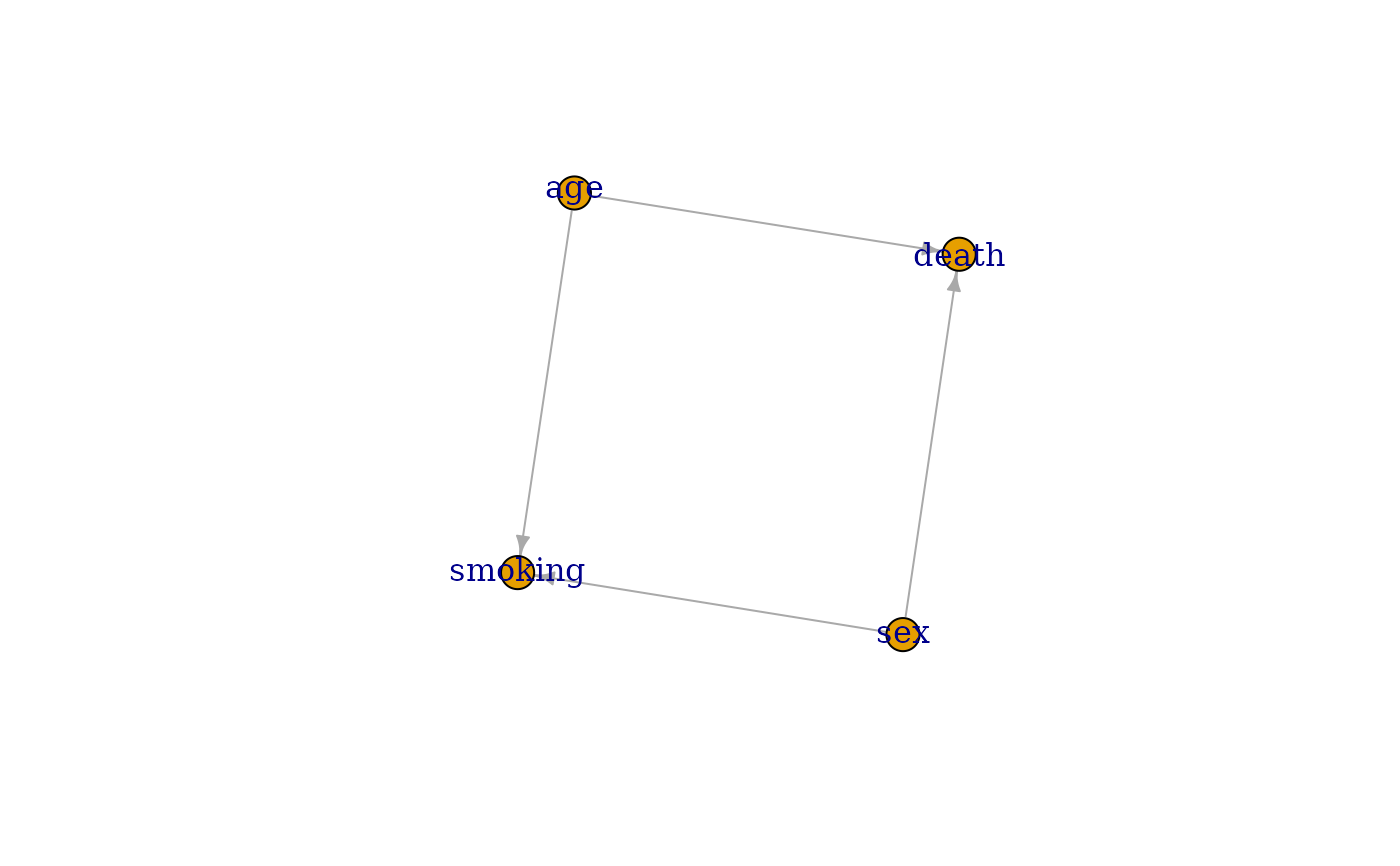
library(simDAG)

# some example DAG
dag <- empty_dag() +
  node("death", type="binomial", parents=c("age", "sex"), betas=c(1, 2),
       intercept=-10) +
  node("age", type="rnorm", mean=10, sd=2) +
  node("sex", parents="", type="rbernoulli", p=0.5) +
  node("smoking", parents=c("sex", "age"), type="binomial",
       betas=c(0.6, 0.2), intercept=-2)

if (requireNamespace("igraph")) {
  g <- igraph::as.igraph(dag)
  plot(g)
}