Plot a calibrated_DAG object
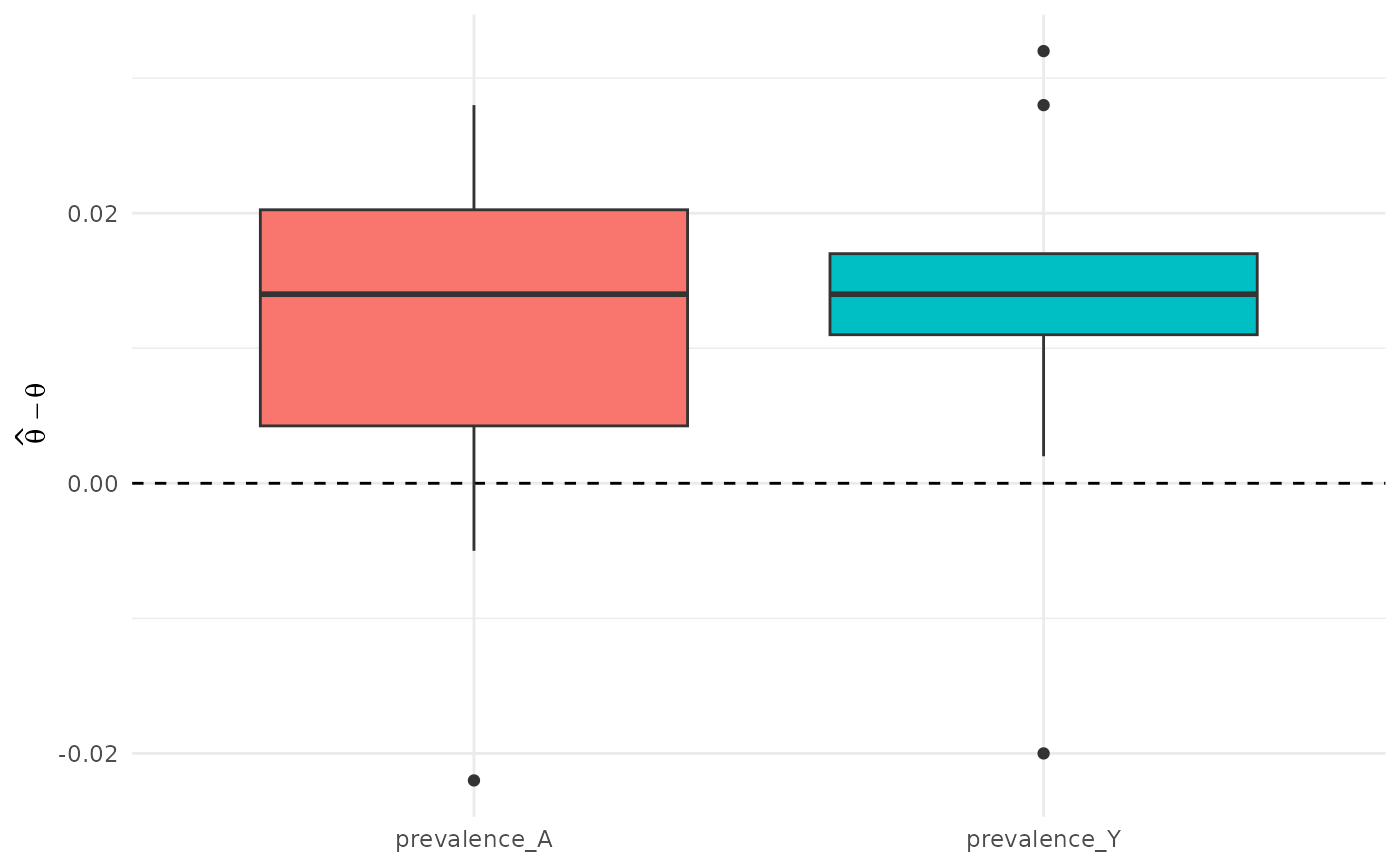
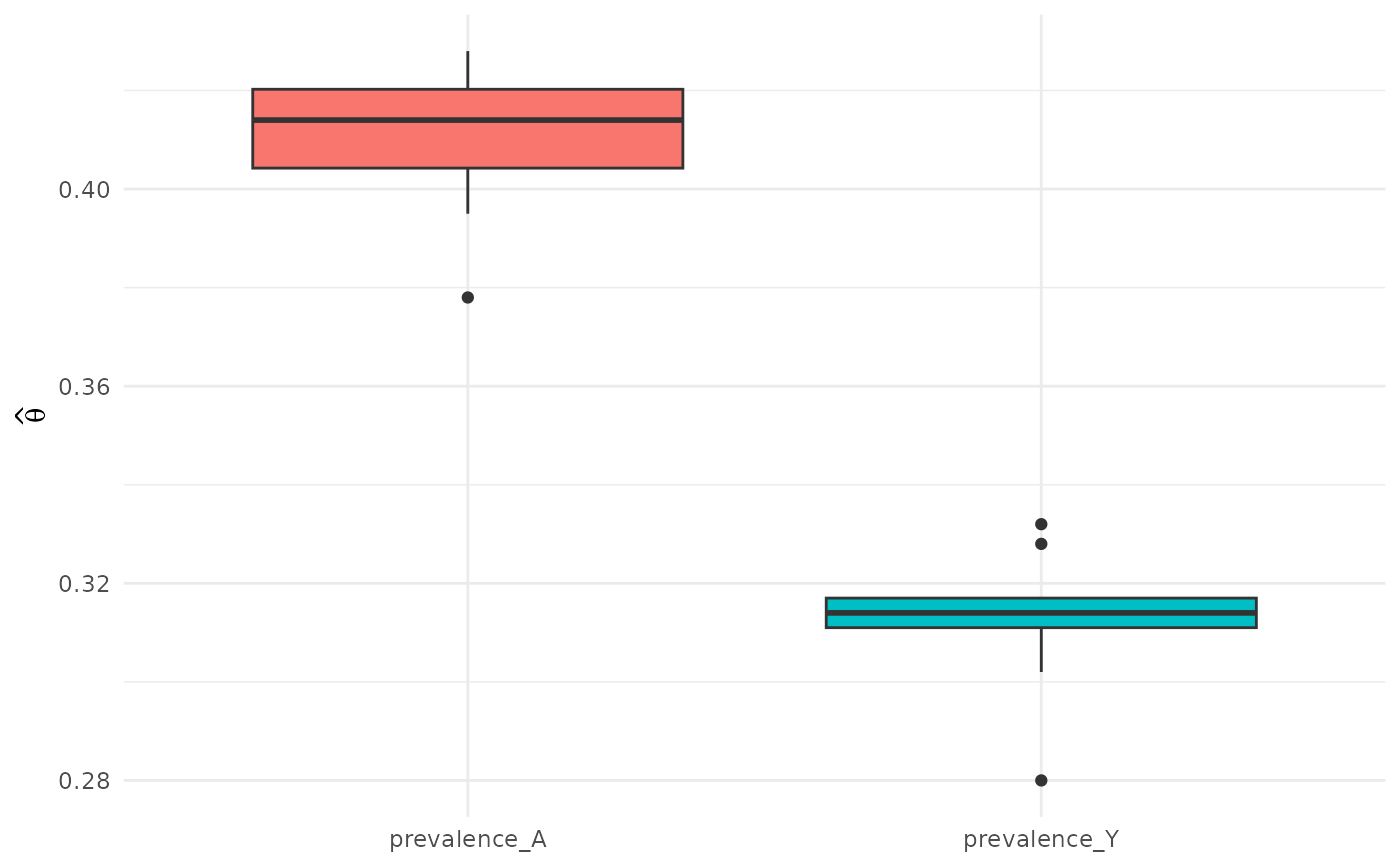
plot.calibrated_DAG.RdThis function may be used to visually inspect how well a calibrate_dag function call was able to approximate the desired targets. If fitted with n_reps_eval > 1, it plots the distribution of the targets estimated on the n_reps_eval evaluation datasets using the determined parameters. Alternatively plots the bias directly.
Usage
# S3 method for class 'calibrated_DAG'
plot(x, type="errors", xlab=NULL,
     ylab="auto", line_at_0=TRUE, ...)
Arguments
- x
A
calibrated_DAGobject created using thecalibrate_dagfunction.- type
A single character string, specifying what should be plotted. Should be either
"targets"(to plot the raw target estimates),"scaled_targets"(to plot the target estimates after applying the user-specified scaling factors, if applicable),"errors"(to plot the difference between the estimated targets and the desired targets, the default) or"scaled_errors"(same as errors, but after applying the user-specified scaling factors, if applicable).- xlab
A single character string specifying the name of the x-axis or
NULL(default) to not use a name.- ylab
A single character string specifying the name of the y-axis or
NULLto not use a name. If set to"auto"(default), the label will be determined automatically based on the suppliedtype.- line_at_0
Either
TRUEorFALSE, specifying whether to plot a dashed line at 0 whenevertype = "errors"ortype = "scaled_errors"is used, ignored otherwise.- ...
Further arguments passed to the
geom_boxplotfunction, allowing users to customize their appearance further.
Details
The function internally relies on the ggplot2 package, so any further ggplot2 syntax may be used to customize the plot. Its main use is to visually assess whether the observed discrepancy between the estimated and desired targets is due to sampling error or a genuine difference.
Examples
# Jointly calibrate treatment and outcome prevalence.
# The DAG contains two free parameters and two targets.
# Parameter ranges are optional.
ldag <- lazy_dag(
empty_dag() +
node("X", type="rnorm") +
node("A", type="binomial",
formula= ~ param(intercept_A) + X * 0.5) +
node("Y", type="binomial",
formula= ~ param(intercept_Y) + A * 0.7 + X * 0.4)
)
targets <- list(
prevalence_A = list(
target = 0.4,
eval_fun = function(data) mean(data$A)
),
prevalence_Y = list(
target = 0.3,
eval_fun = function(data) mean(data$Y)
)
)
params <- list(
intercept_A = list(start = 0),
intercept_Y = list(start = 0)
)
fit <- calibrate_dag(
lazy_dag = ldag,
targets = targets,
params = params,
n_sim_run = 2000,
n_sim_eval = 1000,
n_reps_eval = 10,
seed = 123,
optim_control = list(
maxit = 200,
trace = 0,
ndeps = c(0.05, 0.05),
factr = 100
)
)
summary(fit)
#> ────────────────────────────────────────────────────────────
#> Calibrated DAG
#> ────────────────────────────────────────────────────────────
#> Parameters (2)
#> parameter estimate start lower upper parscale
#> intercept_A -0.3828 0 -Inf Inf 1
#> intercept_Y -1.1368 0 -Inf Inf 1
#>
#> Targets (2)
#> target desired achieved error scaled_error
#> prevalence_A 0.4 0.4104 0.0104 0.0104
#> prevalence_Y 0.3 0.3126 0.0126 0.0126
#>
#> Optimization
#> Optimizer: optim()
#> Method: L-BFGS-B
#> Convergence: unsuccessful (code 52)
#> Objective: 5e-07
#> Evaluations: function 47, gradient 47
#> Message: ERROR: ABNORMAL_TERMINATION_IN_LNSRCH
#> Simulations: 2,000 optimization; 1,000 final evaluation
#> ────────────────────────────────────────────────────────────
# plot the targets directly
plot(fit, type="targets")
 # plot the errors instead
plot(fit, type="errors")